
Short take
Bitcoin and Ethereum have retraced from recent peaks. This raises a debate: is this a routine consolidation after a strong rally, or the early stage of a larger top? This article breaks down the technical picture, the macro backdrop, and what to watch next for traders and investors.
Technical snapshot
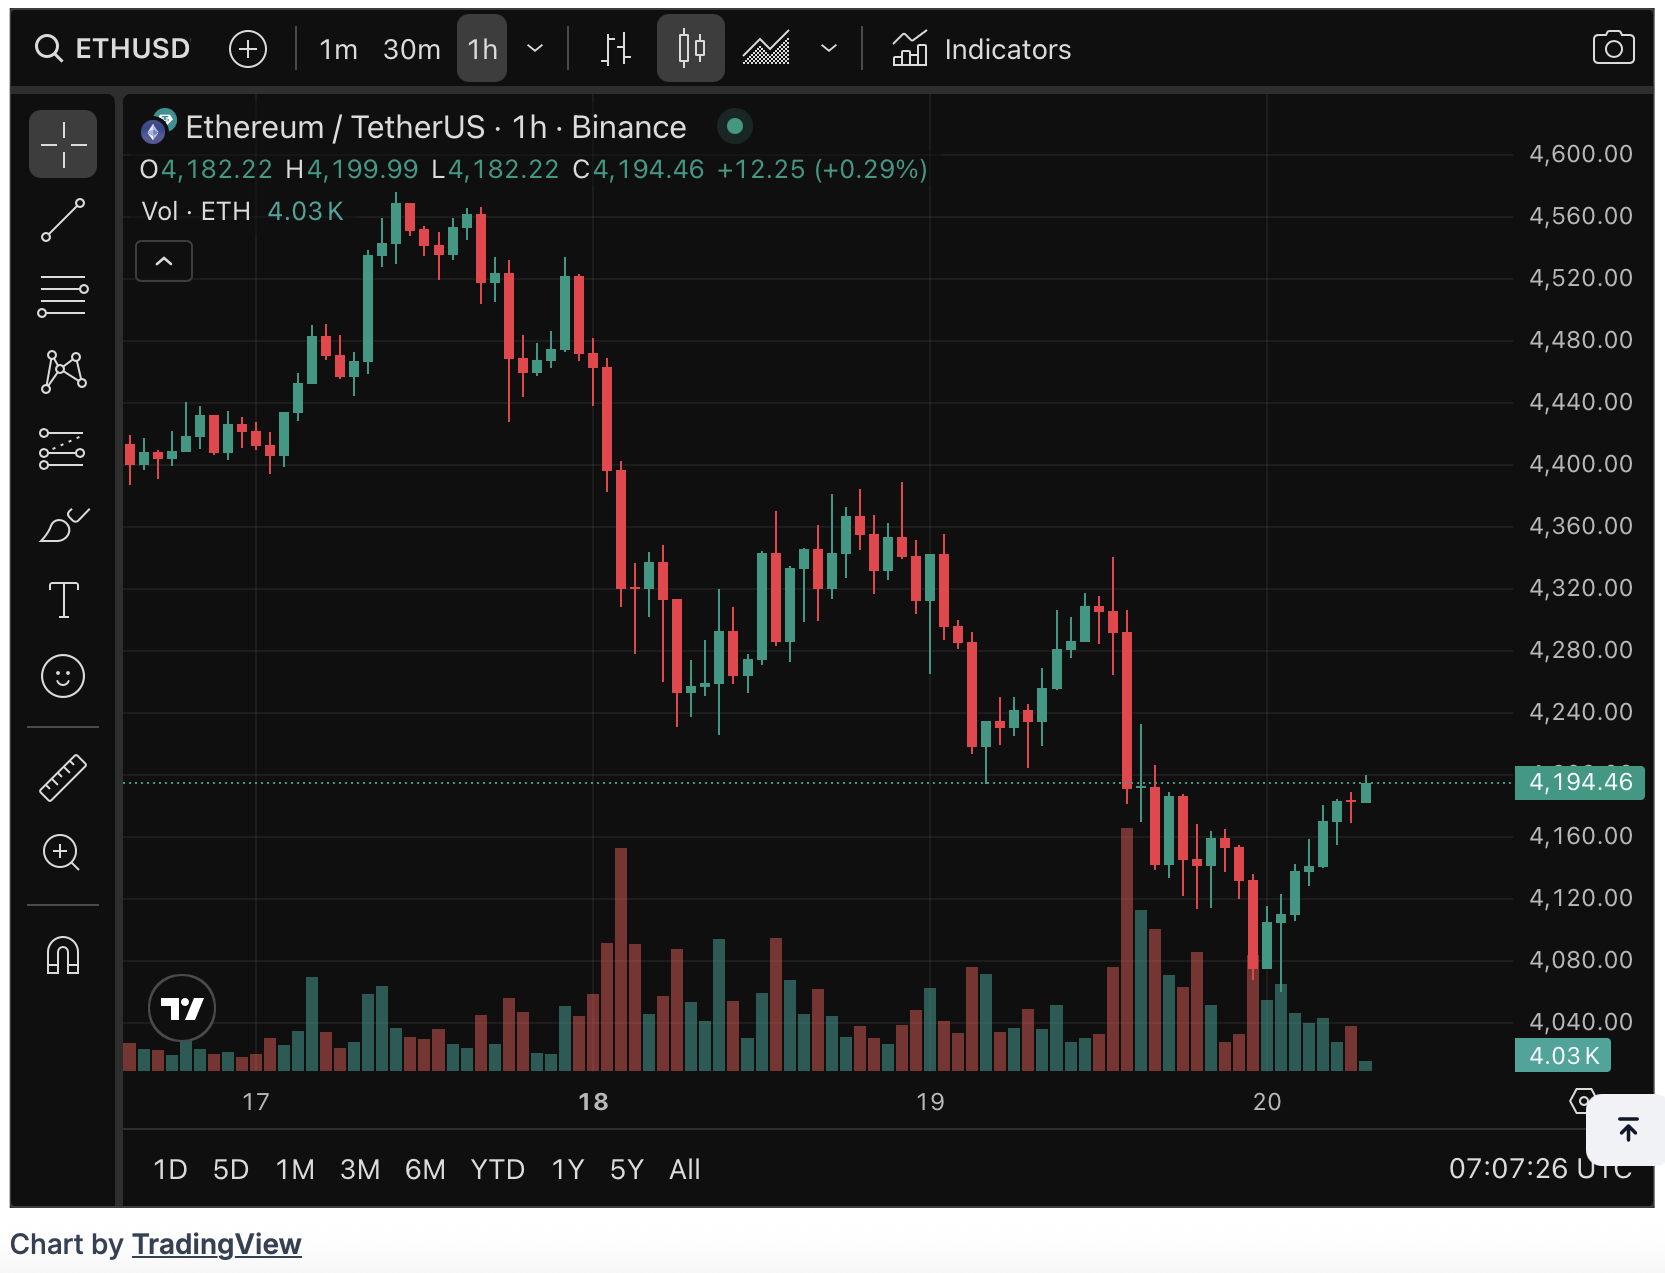
Both markets show common post-peak behaviour: a fast advance followed by a pullback into areas that previously acted as support. For Bitcoin, watch price behaviour around its medium-term uptrend. Traders often use moving averages to gauge short-to-medium term risk. For Ethereum, focus on the support region that held after the recent leg higher. Check whether buyers step in near prior swing zones. Historical price data can be tracked on TradingView.
Bearish signs to respect
- Breaks and daily closes below key trend support often widen the path to lower targets. Momentum and stop liquidity can cascade.
- Negative momentum divergence on daily indicators — where price makes a higher high while the oscillator does not — increases topping risk.
- Large, concentrated leveraged positions make both markets susceptible to forced liquidations. This can amplify downside moves. See crypto liquidation data for current flows.
Bullish Signals Supporting Bitcoin and Ethereum
- Price finding buyers near well-defined support zones and holding them on multiple timeframes suggests the move is a consolidation rather than a reversal.
- Re-acceleration with volume, or reclaim of recent resistance levels, would tilt the risk/reward back in favour of further gains.
- Renewed inflows from institutional vehicles or ETFs can underpin a re-test of recent highs. This is highlighted in ETF fund flow trackers.
Macro and Calendar Considerations for Bitcoin and Ethereum
Crypto markets remain sensitive to shifts in risk sentiment driven by macro data and central bank signalling. Key macro releases and policy speeches can swing risk appetite quickly. Stronger-than-expected inflation or producer-price readings may reduce the expectation of policy easing. This can weigh on risk assets. More dovish signals can re-ignite demand for growth-sensitive assets. Official updates can be followed directly on the Federal Reserve website.
What traders should watch next
- Whether price holds the nearest multi-timeframe support band on daily or weekly closes.
- Volume and open-interest behaviour: does the pullback unwind leverage, or attract fresh selling?
- Reaction to major macro events — payrolls, inflation prints, and central bank remarks — that alter rate-cut expectations. U.S. inflation reports are published by the Bureau of Labor Statistics.
- How correlated tech equity performance is with crypto flows. A tech-led risk-off episode can pressure both at once. Track this via the Nasdaq 100 index.
Practical Risk Management Notes for Bitcoin and Ethereum
Use defined risk points. Size positions to the distance to invalidation levels. Monitor leverage exposure and avoid adding into rapidly-moving selloffs without confirmation. For investors with longer horizons, assess whether short-term volatility changes your view of the long-term thesis.
Final thoughts
The current pullback looks consistent with a healthy consolidation for most scenarios. However, technical failures under key support bands, combined with macro surprises, could trigger a deeper correction. Watch support, market structure, and macro catalysts. Their combination will decide whether this is a pause or a top.