The XRP price outlook is currently showing signs of volatility as the token tests key support and resistance levels. Traders monitoring XRP should pay close attention to the 55-day simple moving average (SMA) and recent swing highs and lows, as these can indicate potential bullish or bearish moves. For real-time price updates, check TradingView XRP/USD chart.
XRP Price Outlook: Key Support Levels to Watch
The immediate support zone for XRP is between $2.90 and $2.95, aligning with recent monthly lows. A sustained drop below this area may push XRP toward stronger support at $2.73. If this level is breached, the next potential support target is around $2.65, which would test the medium-term uptrend.
Bullish Scenarios
Despite downward pressure, XRP is attempting to stabilise above the 55-day SMA at approximately $2.90. Maintaining this support and surpassing mid-August highs near $3.15 would signal that the medium-term uptrend remains intact. A rise above $3.38 could then position XRP to challenge the July high near $3.66, offering significant bullish potential. For reference on crypto fundamentals, see Investopedia Cryptocurrency Guide.
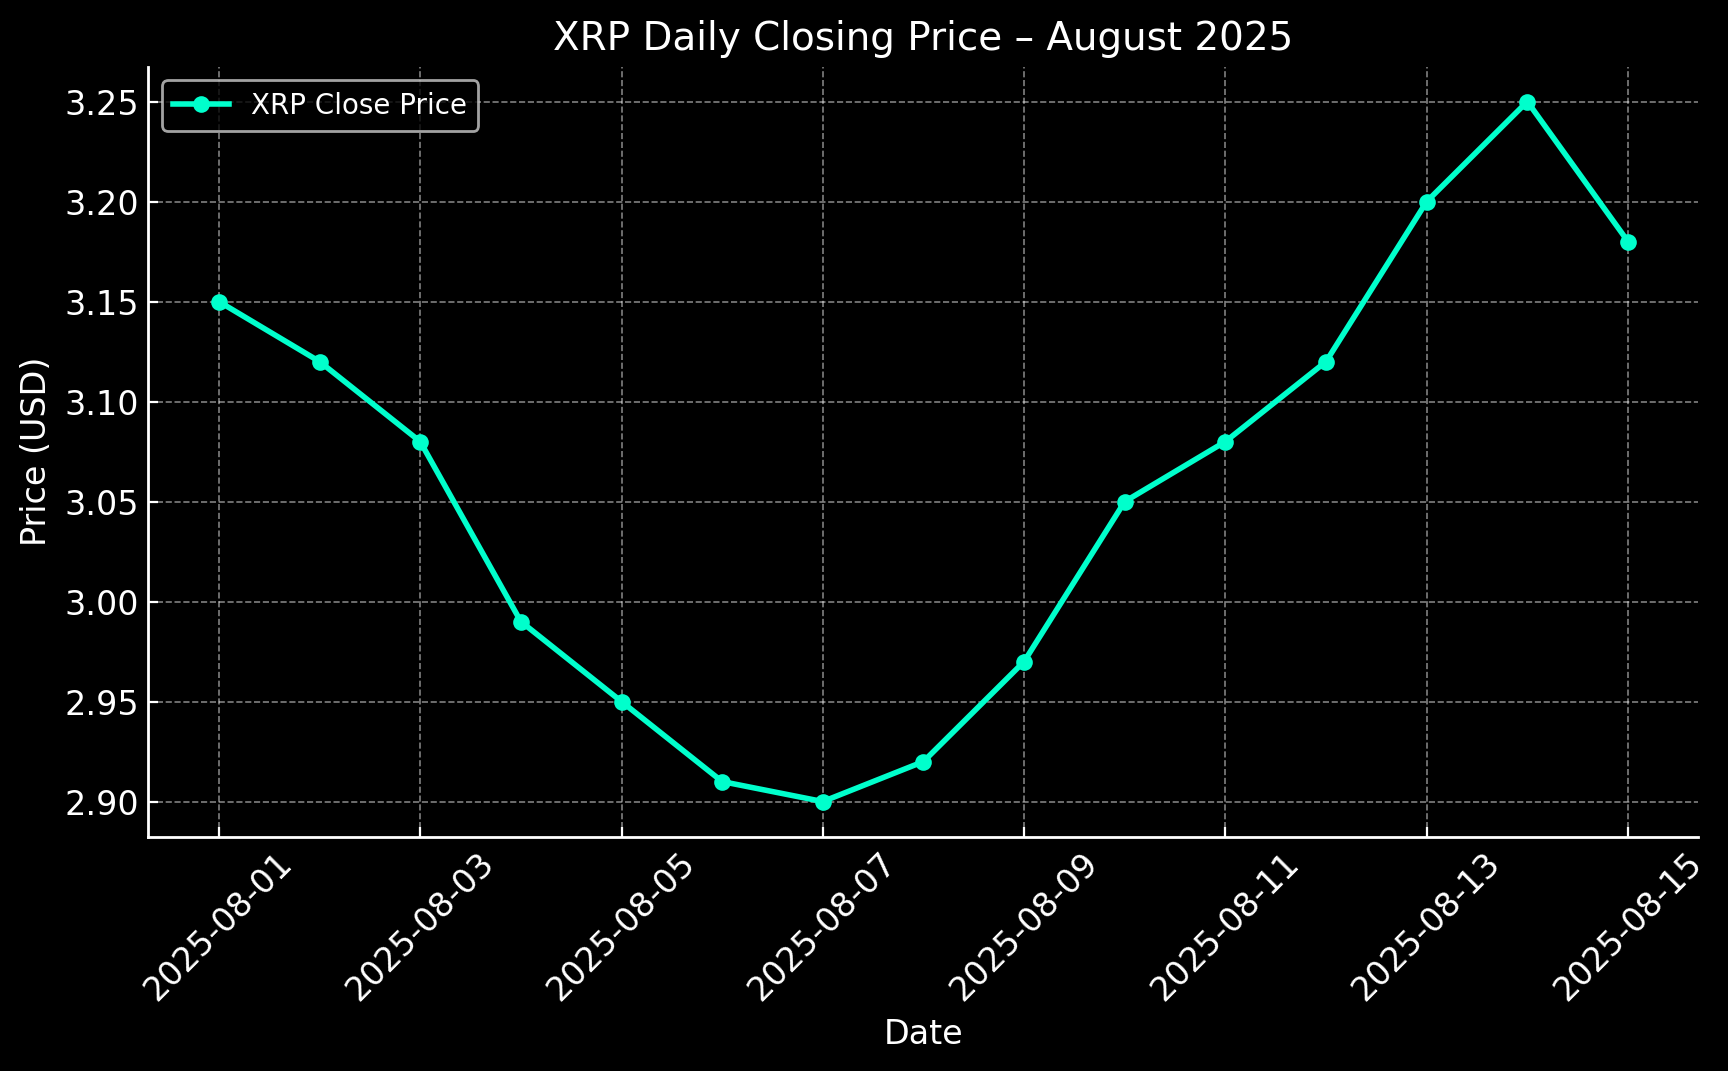
Chart: XRP daily closing prices in August 2025. Data source: TradingView.
XRP Price Outlook: Potential Bearish Scenarios
On the downside, failing to hold the $2.90 support could see XRP retesting the early August low at $2.73. A further breakdown may target the May peak at $2.65. Traders should watch volume and momentum indicators for early warnings of accelerating downside risk. More detailed historical data can be found at CoinMarketCap XRP Historical Data.
Technical Indicators to Watch
Key indicators include the 55-day SMA, short-term trend lines, and recent swing highs and lows. Momentum indicators, such as RSI and MACD, provide insight into potential trend reversals or continuation patterns.
Final Thoughts
XRP is balancing between critical support and resistance levels. A rebound above August highs would indicate bullish potential, while a drop below $2.90 could suggest further downside. Traders should track these levels and technical signals to anticipate the token’s next move.