
The July CPI core inflation data revealed a clear contrast between subdued headline figures and underlying price pressures. On the surface, overall price growth appeared contained, giving the impression that inflationary pressures were easing. However, once volatile components such as energy and food are stripped out, the core trend looks noticeably firmer. This divergence matters because central bankers and markets pay particular attention to persistent, broad-based inflation rather than temporary swings. For full historical CPI data, see the U.S. Bureau of Labor Statistics.
July CPI: What the Numbers Tell Us
Month-on-month measures showed modest movement in headline prices, with energy-related declines tempering the print. By contrast, core measures — which exclude energy and food — edged higher, driven by stronger readings in non-housing services and goods categories where pass-through from import prices and sector-specific pressures is evident. Shorter-run annualised measures show a faster pace in core than in headline, suggesting momentum beneath the surface even where the headline rate seems benign.
Sectoral drivers
Core goods prices have picked up meaningfully in recent months, consistent with higher costs in imported goods or concentrated supply-chain frictions. Meanwhile, services inflation outside of housing — sometimes referred to as “supercore” — remains elevated, reflecting resilient wage and demand dynamics in face-to-face and contracted services. Together, these components make the inflation profile less straightforward than a single headline number would suggest.
July CPI: Policy and Market Implications
For policymakers, the question is whether the rise in core inflation is transient or likely to embed itself in broader price-setting behaviour. If underlying inflation proves persistent, officials may be reluctant to ease policy quickly. From a market perspective, pricing for future rate moves is sensitive to these nuances: headline prints can temper immediate reactions, but sustained core strength tends to shift expectations for the timing and scale of policy adjustments.
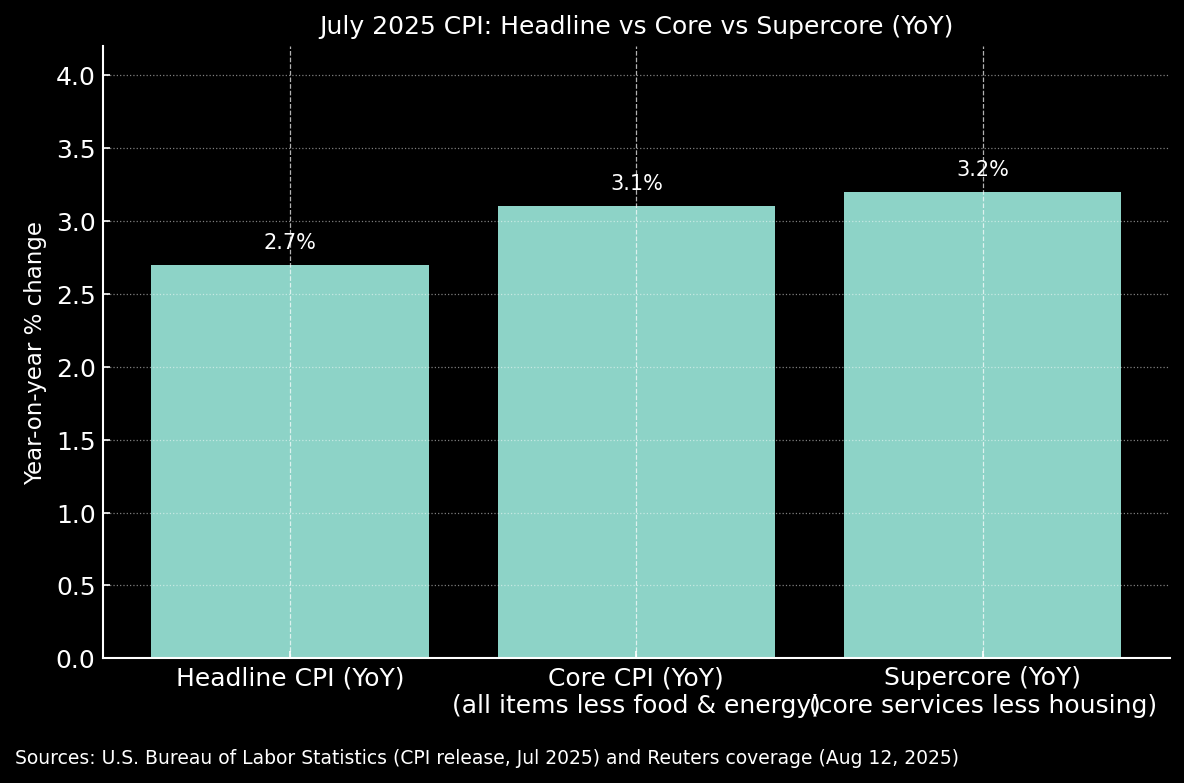
Chart: July 2025 CPI — Headline vs Core vs Supercore (Year-on-Year). Sources: U.S. Bureau of Labor Statistics; Reuters.
BLS release,
Reuters.
Risks and uncertainties
Several uncertainties complicate the outlook. Trade-related price effects, episodic supply dislocations, and shifts in consumer behaviour can all amplify or mute inflation readings. Labour market resilience is another wildcard: even modest loosening in hiring conditions would influence how aggressively policymakers respond to core inflation trends.
What to watch next
- Subsequent monthly CPI and PCE prints for confirmation of the core trend.
- Labour market indicators for signs of cooling or further strength.
- Any material developments in trade and supply chains that could affect goods prices.
In short, headline numbers may offer a calmer headline, but the persistence in core readings warrants careful attention. Markets and policymakers will be monitoring follow-up data closely to determine whether current inflation dynamics are temporary or the start of a more entrenched trend.